1The page at a glance
Analytics has two tabs. Overview holds the numbers most owners check: money, patients, visits and what’s selling. Revenue Intelligence digs into money owed, renewals and risk.
Practice patients are never counted in any number here.
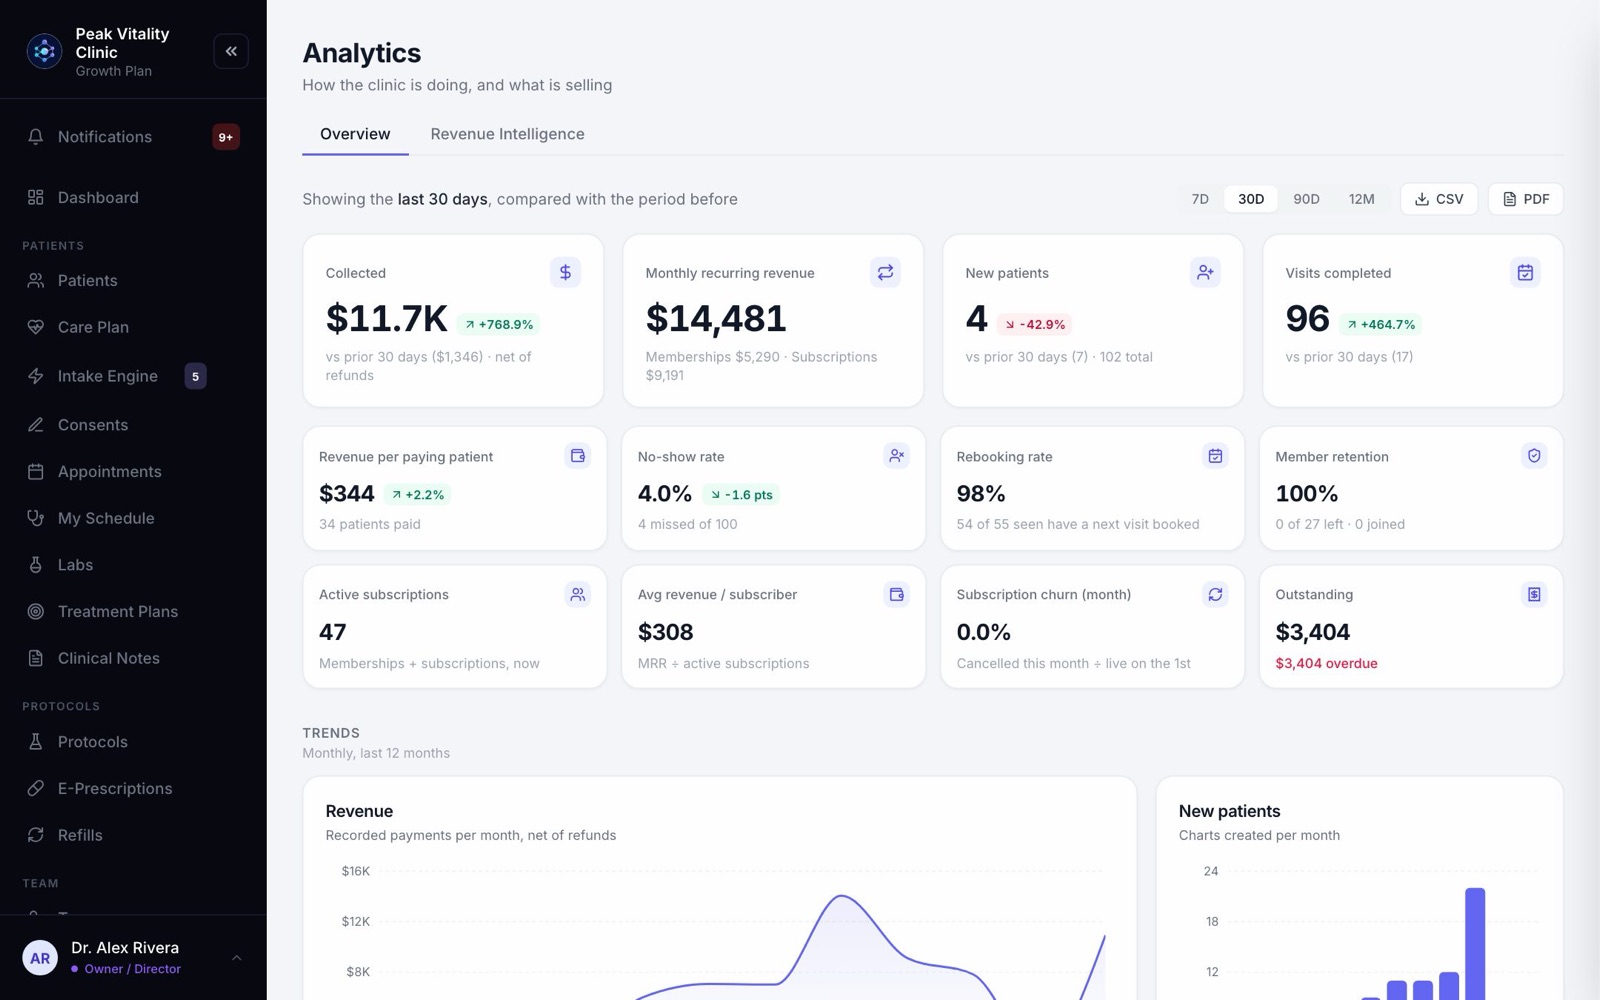
2Pick a time frame
- 1Pick 7D, 30D, 90D or 12M: the last 7 days, up to the last 12 months.
- 2The line on the left says which time frame you’re looking at.
- 3A small colored tag compares a number with the same length of time just before. Green is better. Red is worse.
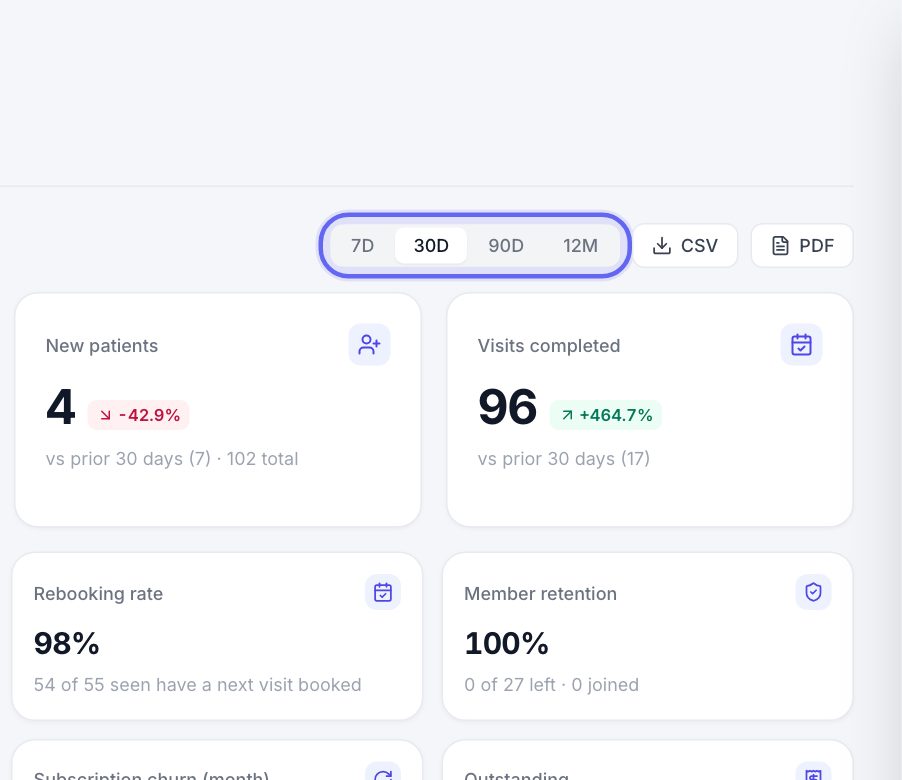
3The four big numbers
- 1Collected: the payments recorded in your time frame, less refunds.
- 2Monthly recurring revenue: what your active memberships and subscriptions bring in each month.
- 3New patients: patients added in your time frame, with your total under it.
- 4Visits completed: visits finished in your time frame.
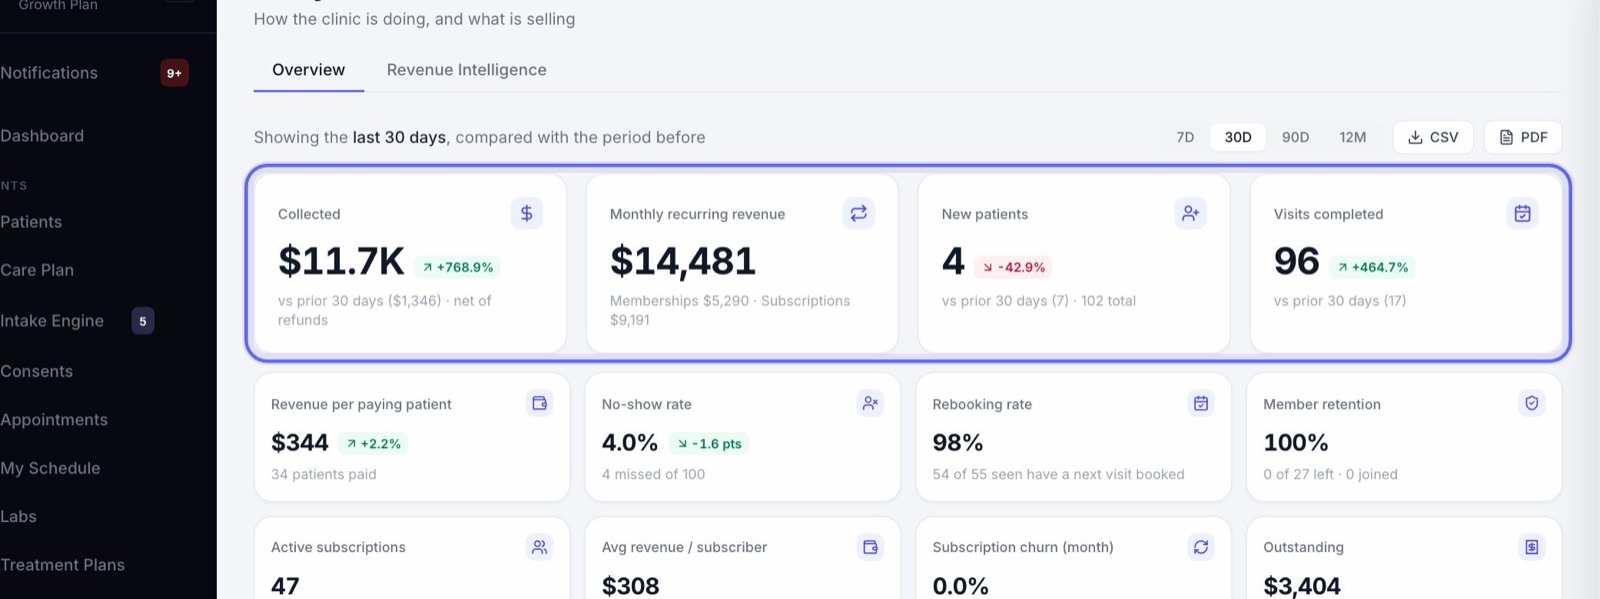
4The finer numbers
Under the big four: revenue per paying patient, no-show rate, rebooking rate (patients seen who already have a next visit), member retention, active subscriptions, average revenue per subscriber, and this month’s subscription churn. The small line under each says how it’s counted.
Outstanding is what patients owe right now. It is the same number Billing shows. Click it to go to Billing.
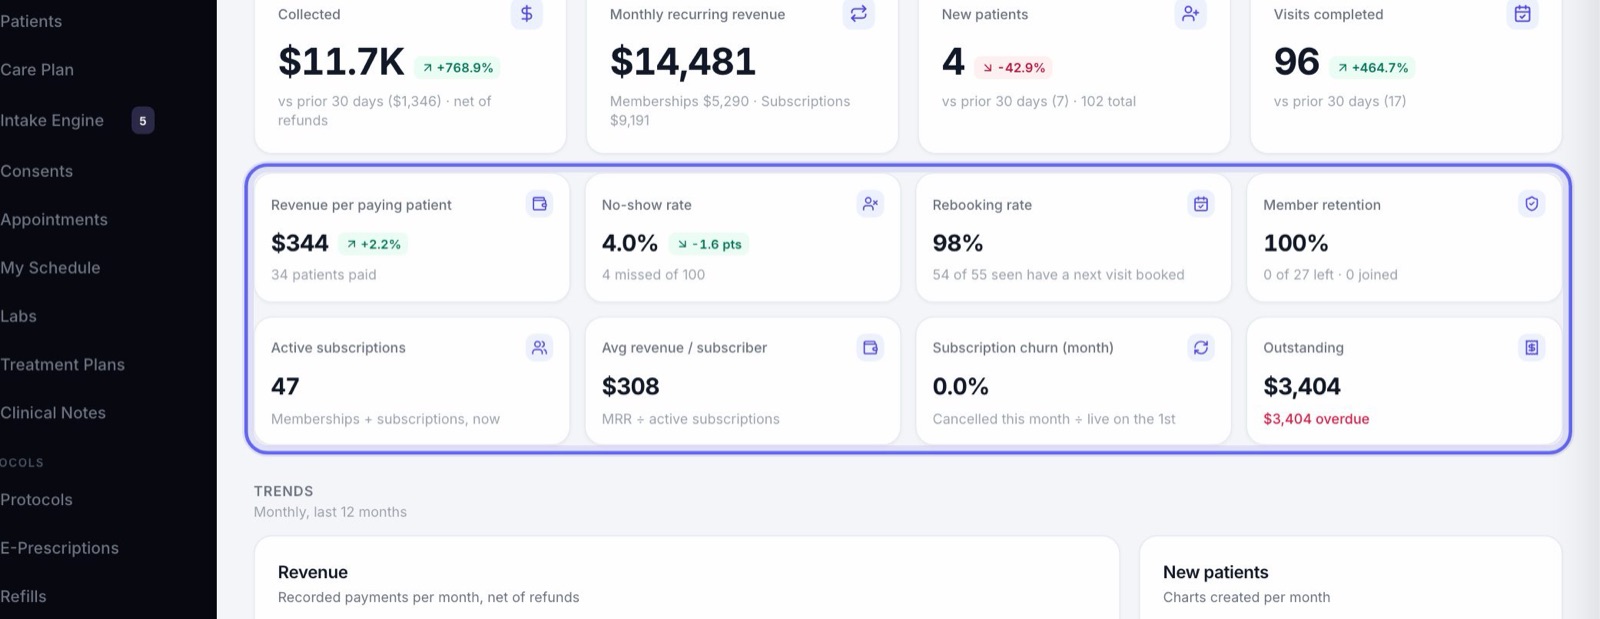
5Month by month
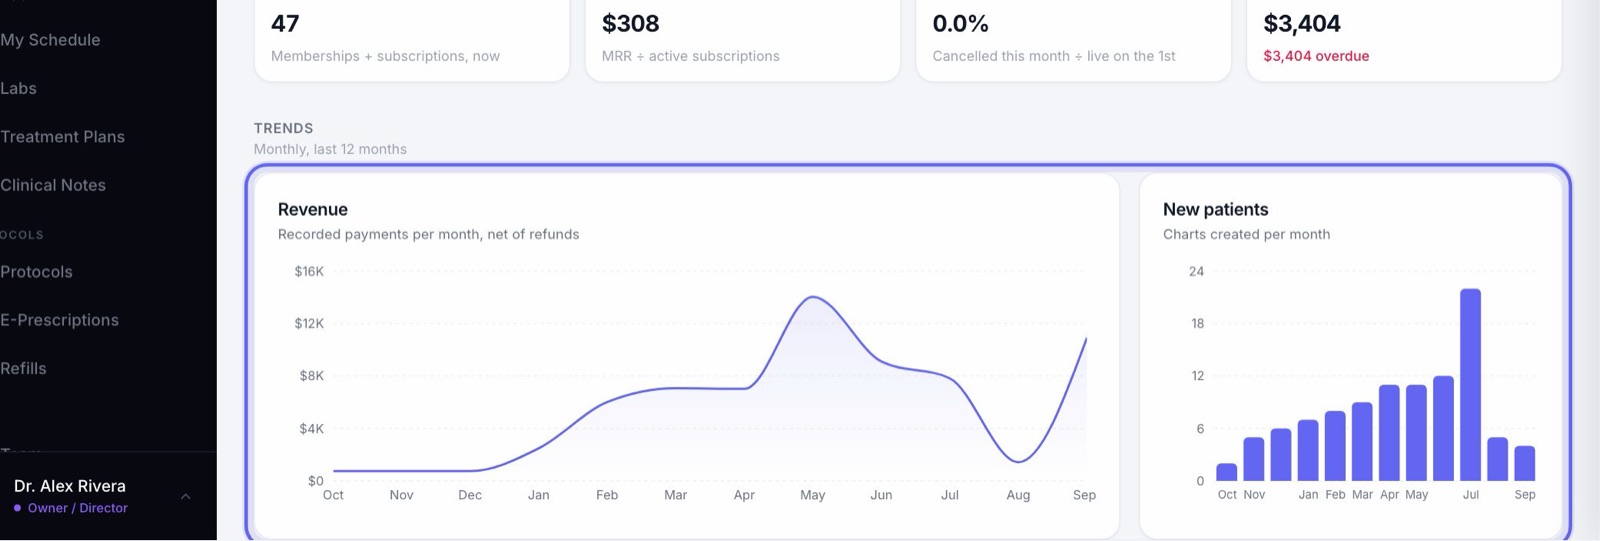
Revenue shows the payments recorded each month for the last 12 months, less refunds. New patients shows how many charts were made each month. Hold your mouse over a month to see its number.
6What’s selling
- 1Pick Memberships, Subscriptions, Services or Products.
- 2Memberships and subscriptions show how many are active now, how many started and were canceled in your time frame, and what they bring in each month.
- 3Services and products show how many sold and for how much, from paid invoices in your time frame.
- 4The chart shows the top 10. The table beside it has them all.
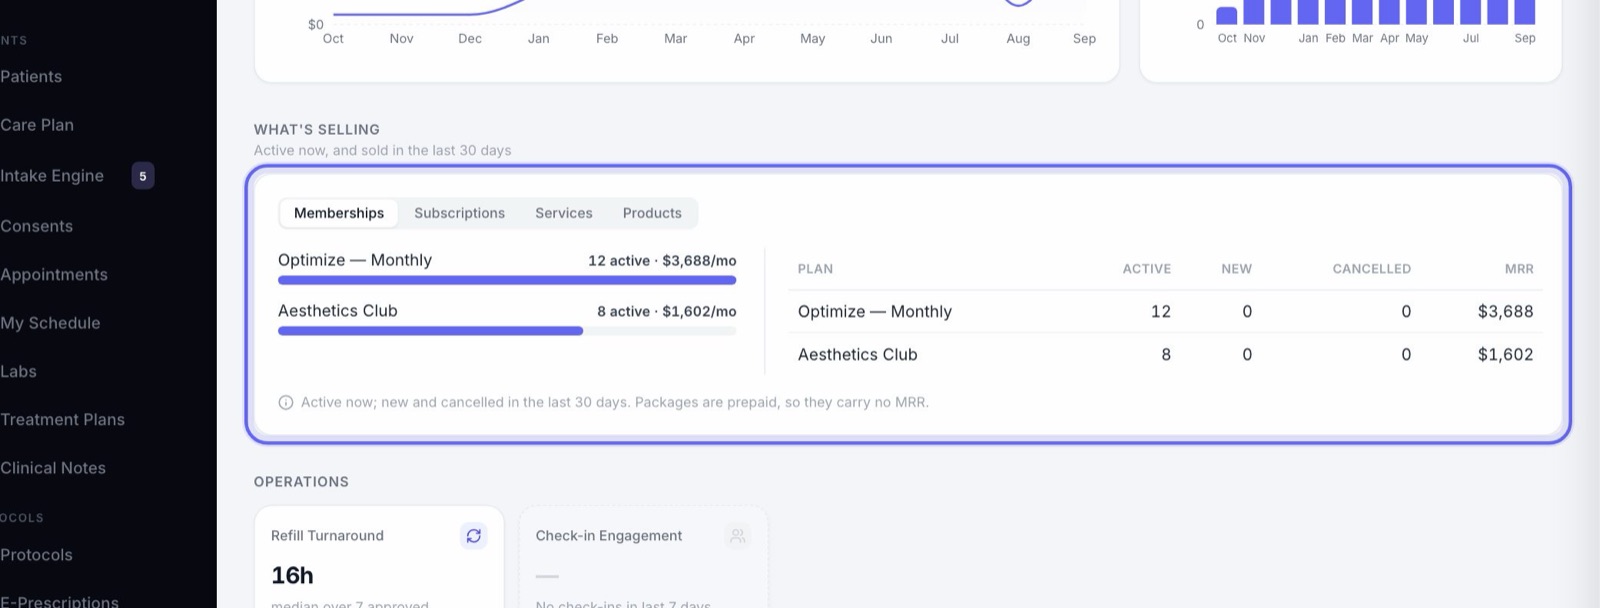
A custom line on an invoice doesn’t match anything in your catalog, so it’s counted apart. Pick items from your price list when you can.
7Operations
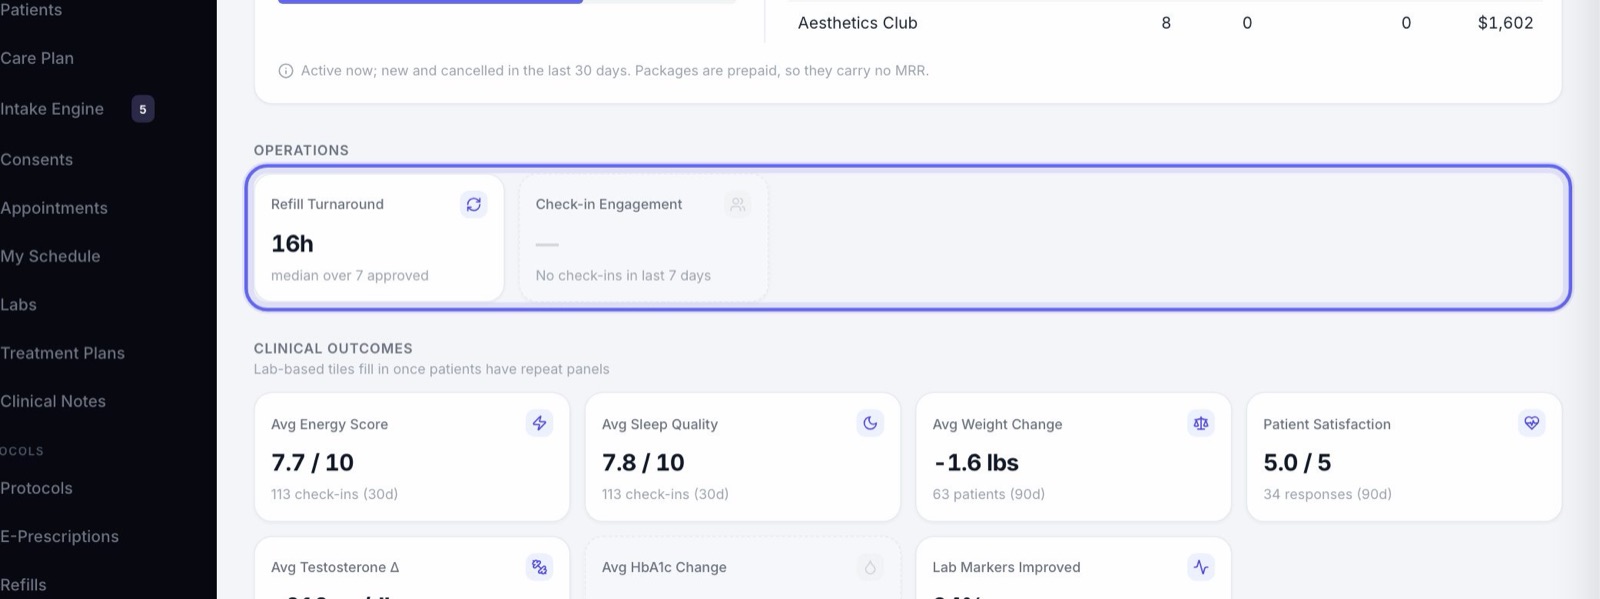
How the clinic is running: the no-show rate over 90 days, how many refill requests have been dealt with, how long refills wait for approval, how many patients sent a check-in this week, and how many protocol enrollments are active.
8Patient outcomes
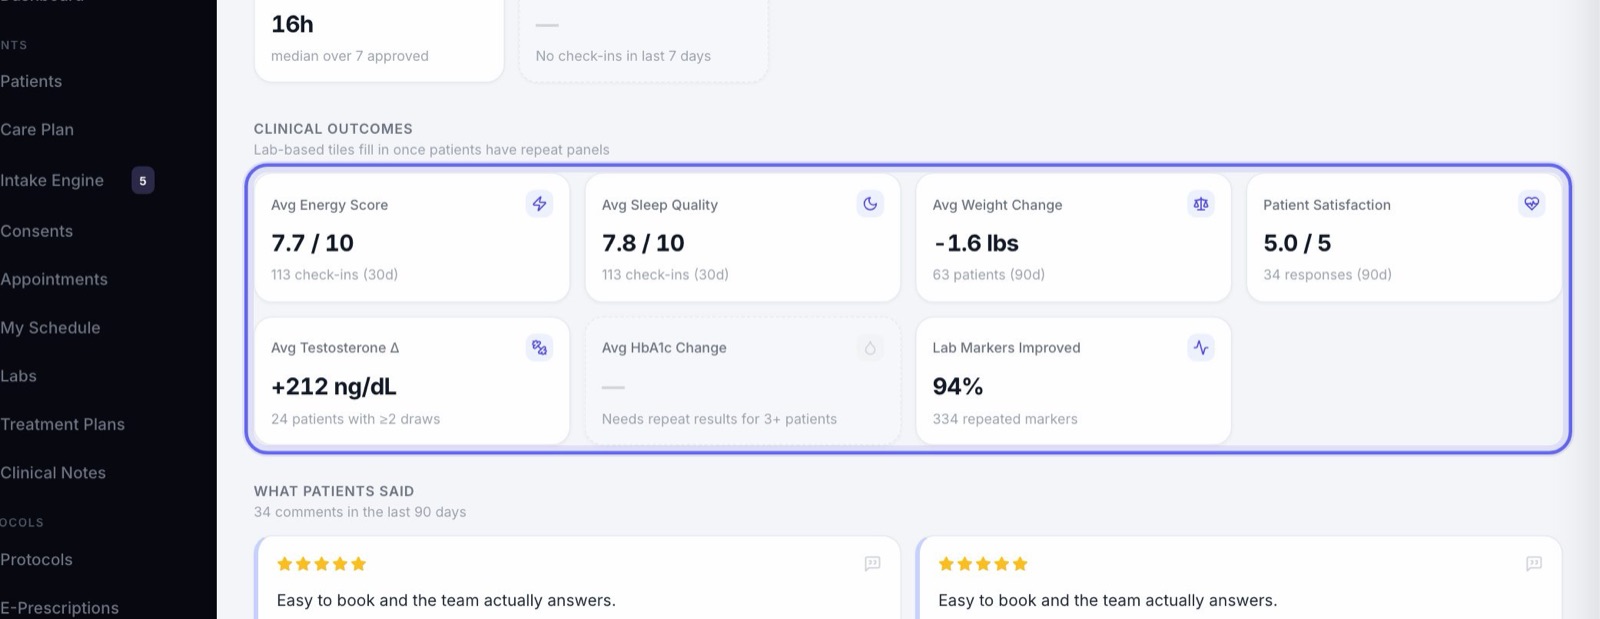
Energy and sleep scores from patients’ check-ins, average weight change, patient satisfaction, and changes in lab results.
A dash means there isn’t enough data yet. The lab tiles fill in once patients have repeat results.
10Take it with you
CSV downloads these numbers as a spreadsheet. PDF downloads them as a report you can print or send.
11Revenue Intelligence
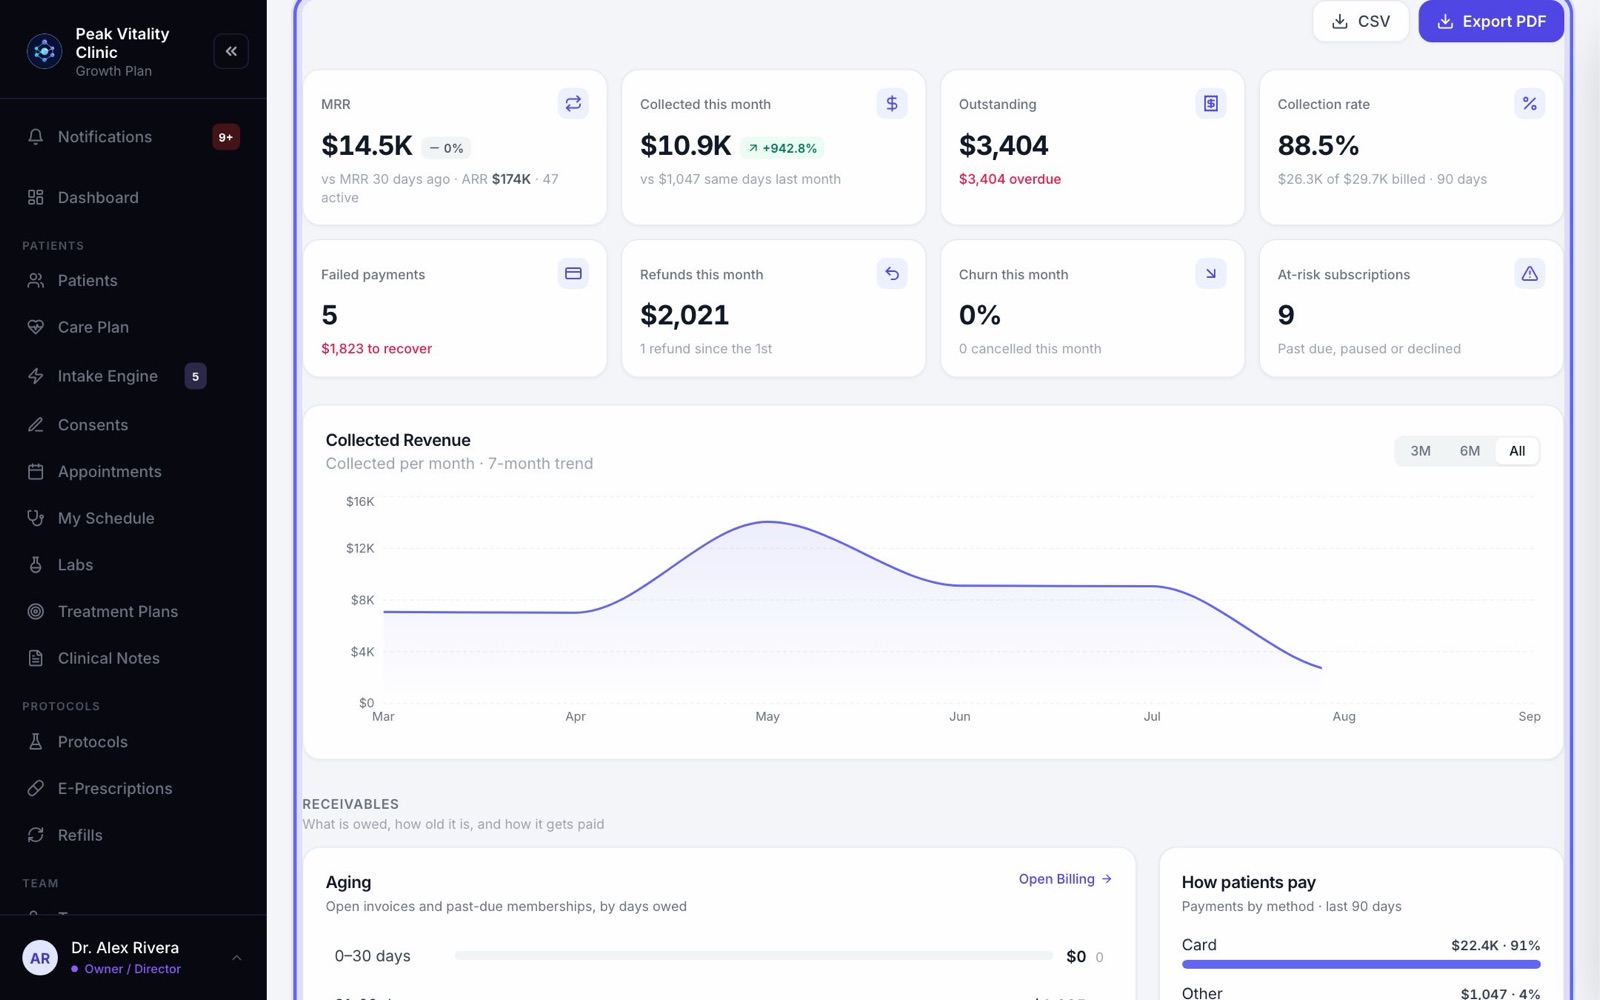
Open the Revenue Intelligence tab. Across the top: monthly recurring revenue, collected this month, outstanding, collection rate, failed payments, refunds this month, churn this month, and at-risk subscriptions.
Under that is collected revenue per month. Switch it between 3M, 6M and All. Failed payments opens the membership charges that didn’t go through.
12Receivables
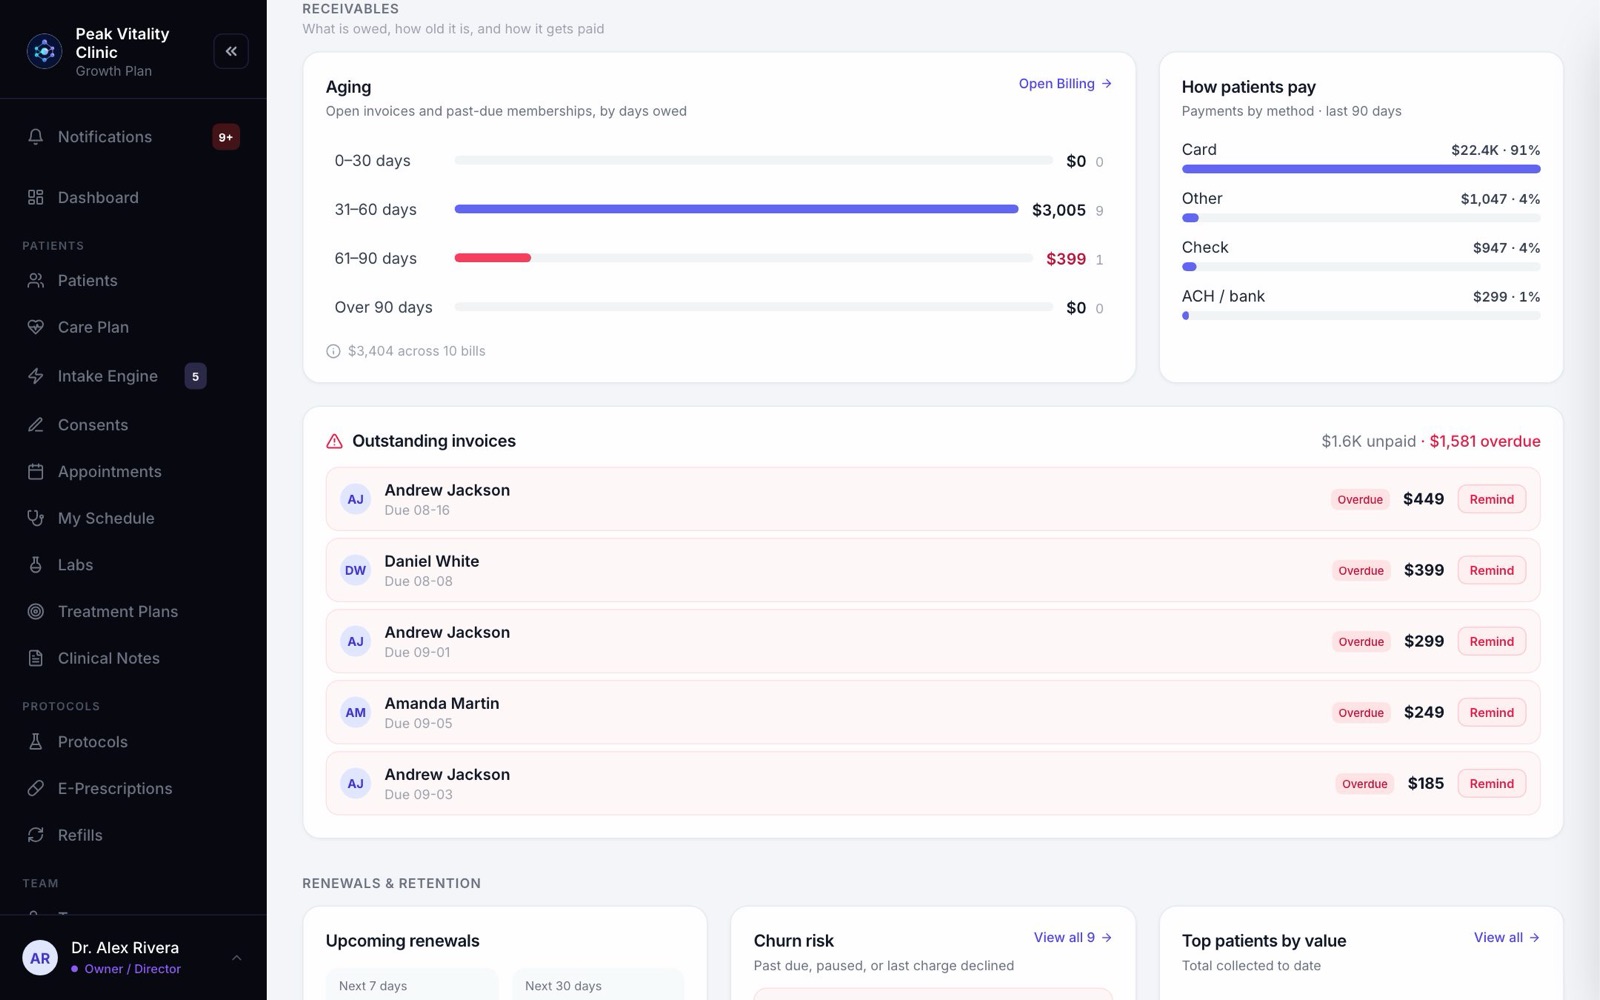
- 1Aging splits what’s owed by how long it has been owed. Click a row to go to Billing.
- 2How patients pay shows payments by method over the last 90 days.
- 3Outstanding invoices lists who owes, the biggest first. Overdue ones are marked.
13Renewals and risk
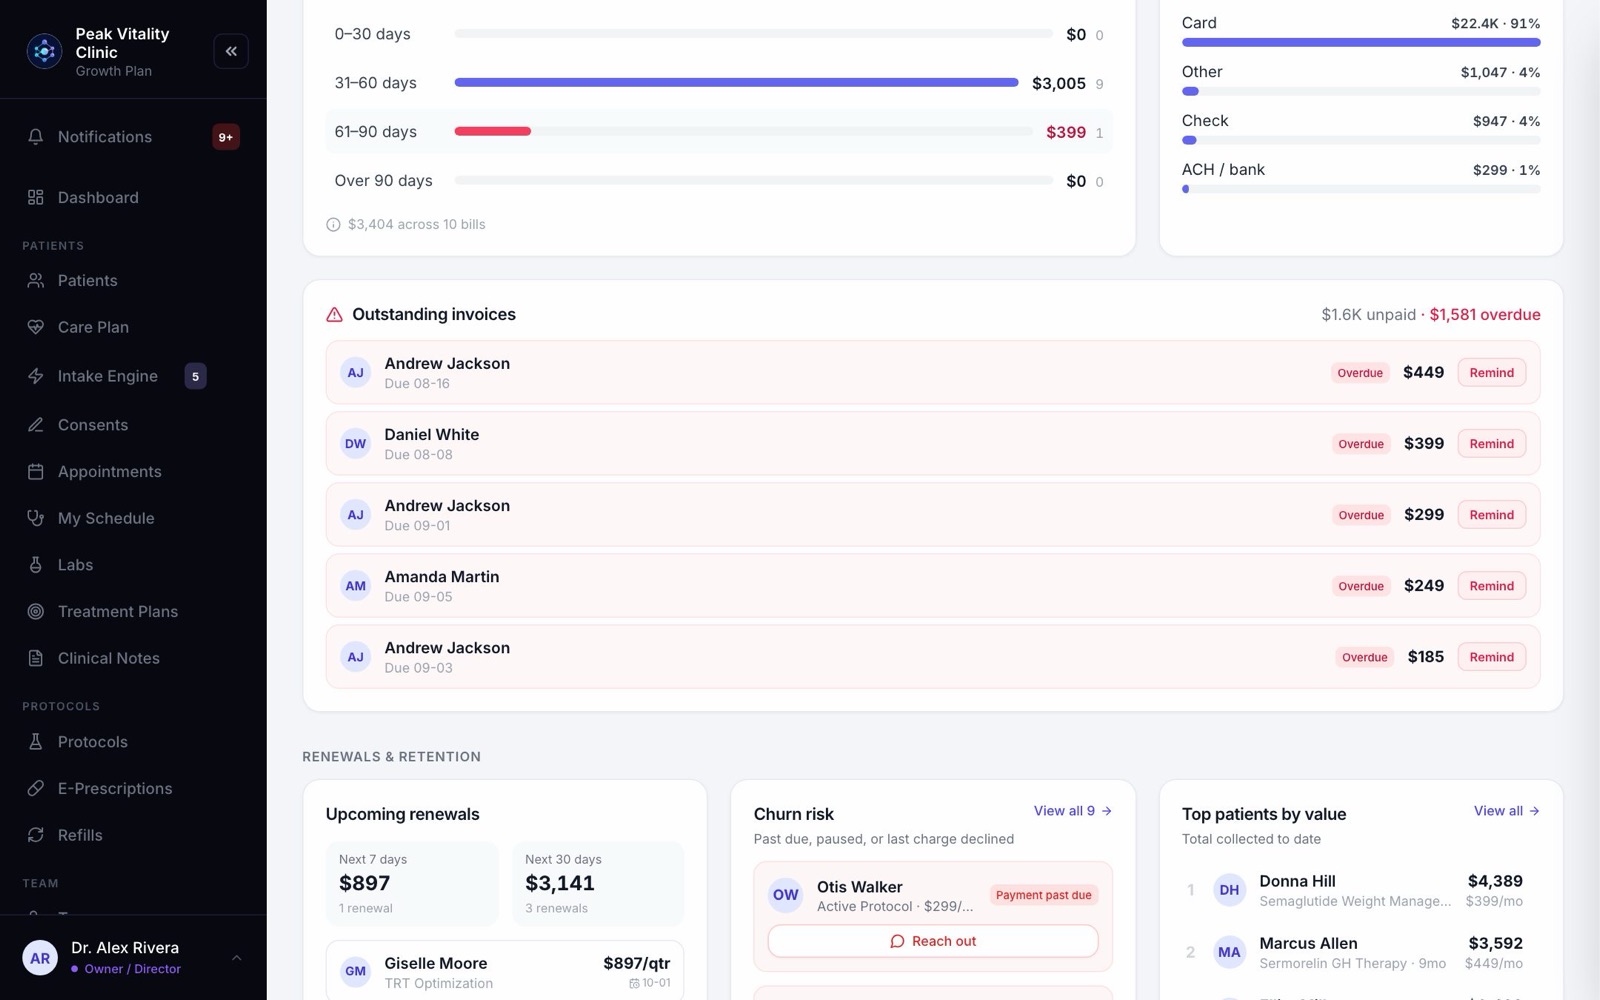
- 1Upcoming renewals shows the plans that renew in the next 7 and 30 days. Click one to see that patient’s plans.
- 2Churn risk lists plans that are past due, paused, or had their last charge declined. Reach out opens a message to that patient.
- 3Top patients by value ranks patients by what they’ve paid so far. Before any payments are recorded, the line under the title says it’s an estimate.
14Profitability
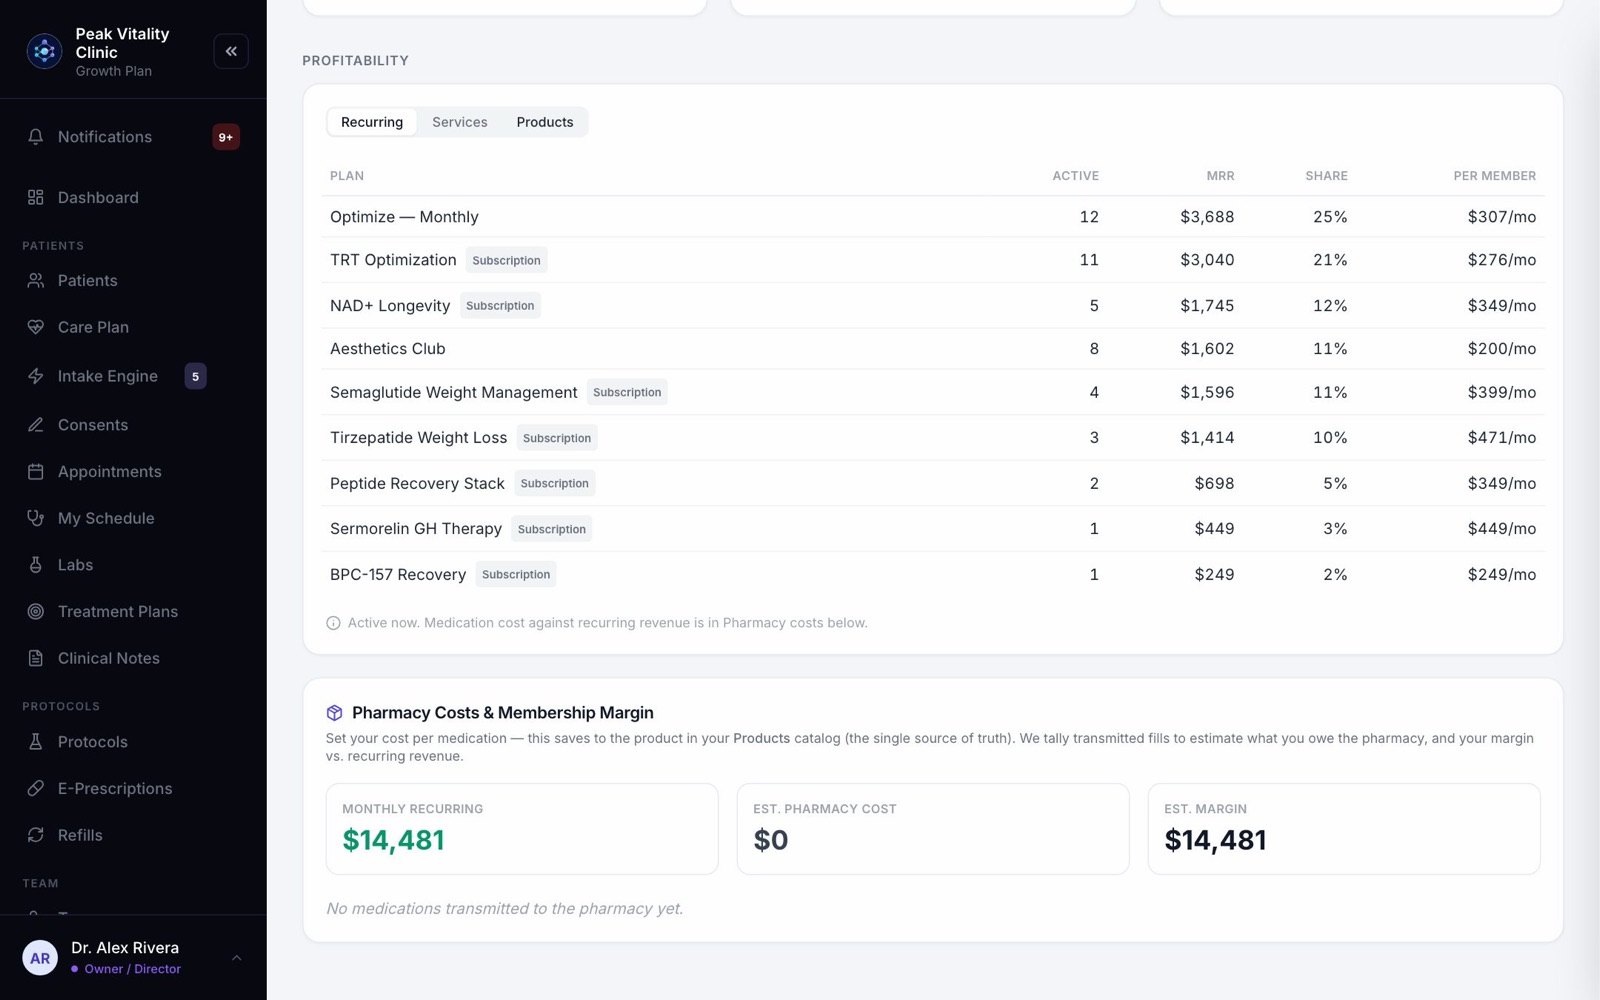
Pick Recurring, Services or Products. Recurring shows each plan, how many are active and what it brings in each month. Services and products show what sold in the last 90 days.
Add a cost price to a product in Products, and its cost and margin show here too.
Keep going
Billing
Bill patients, take payments and keep track of what’s owed. Make invoices, record and refund payments, print receipts, and set up your discounts.
Read the guidePayments and checkout
Money from start to finish: the deposit when a visit is booked, the charge at the visit, the receipt, a refund if one is needed, and where it all shows up.
Read the guideDashboard
Your clinic at a glance. Today’s numbers, who is coming in, the money taken, work that needs a person, and the bell where anything new for you lands.
Read the guideFor owners and practice managers
Everything you need to set up the clinic, bring your team in, decide who can do what, and keep an eye on the money and the day.
Read the guideRather be shown?
Inside Aminova, the tutorial walks you through every page, and the Getting started checklist shows you each task click by click. Or book a live training session with our team.
9What patients said
The comments patients wrote with their rating in the last 90 days, each with its stars. Low scores have a red edge. This part shows up once someone has left a comment. Press Show all to see more than four.